Firebug 1.0: It’s Hot, Baby, Hot!
Published Jan 27, 2007If you have anything at all to do with making web pages, you’ve gotta get Firebug. After a year of beta development, developer Joe Hewitt announced the final release of Firebug 1.0 on Wednesday. And friends, it’s a web developer’s dream.
Firebug is an extension for the Firefox browser that allows you to explore, troubleshoot and experiment with any page’s HTML, CSS or Javascript—all live in the Firefox browser. Whether you’re a novice designer learning the ropes of HTML and CSS or a veteran developer of sophisticated JavaScript-driven web apps, the new Firebug is a must-have for your toolkit.
Firebug is a free, open-source project, but Joe accepts donations with a recommended contribution of $20. It’s worth much more than that, so if you find it useful, please… consider sending him a little coin.
I’ll do a quick rundown of Firebug’s features here, but the best way to gist it is simply to give it a try. You can also see it in action with this screencast intro to Firebug’s HTML/CSS inspector features, put together by Jesse Newland. For power users, there’s also a video of Joe Hewitt himself giving a demo at the mighty Yahoo HQ, with an overview of many of Firebug’s JavaScript debugging tools.
But here’s the nickel tour.
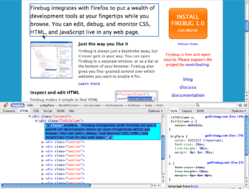
Firebug runs in a little console at the bottom of the Firefox browser; a single click conjures or dismisses it (you can also detach Firebug into a separate window).
Inspect HTML and CSS

To inspect any element of the page, click the Inspect tab then the element to explore. The console shows the element’s HTML contents in the left window. The right side of the console shows all of the CSS styles that apply to the element.
The truly cool thing about the CSS display is that you can see all of the element’s inherited styles, including styles that have been overridden along the inheritance path (or “cascade”). In the screenshot above (click to enlarge), you can see that the color attribute for .leftColumn paragraphs has been overridden for the selected paragraph by the .bigPara class. Ditto for the p paragraph styles for font-size, line-height and margin.
If you ever have a page where your CSS styles don’t seem to be behaving, this is a hyper-efficient way to discover why. It even shows you the line number of every style declaration in your style sheet. Click the line number, and the console opens the style sheet at that line number, ready for editing.
Edit in Place

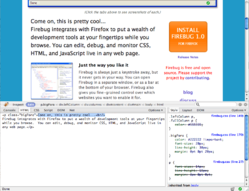
Just about everything that you see in the console can be edited. Select the item to edit, click the edit tab and type in any HTML that you like. The display updates in real time in your browser, making it easy to experiment with changes in your browser.
The same goes for CSS. Click on any attribute, and enter a new value (or just use the up and down arrow keys to increase/decrease the value by one unit). You can do free-form editing of an entire CSS style sheet by clicking the CSS tab, choose your style sheet from the dropdown menu and click “Edit.” Here again, the page display updates immediately to show your changes.
Nope, the changes aren’t saved, and they’re not permanent; it’s just a way to see what changes might look like before applying them to your actual page.
“A lot of people are comparing Firebug to Dreamweaver,” Joe says. “I wouldn’t do that. It’s not trying to replace Dreamweaver. The model for using this feature is that you want to find out what effect a change has. Then you want to take the changes back to your text editor and actually cement that change into place.”
Network Activity and Page Weight

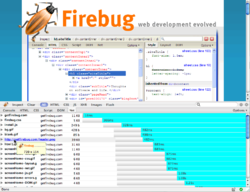
Firebug’s Net tab displays all of the files loaded for the current page, along with each item’s file size and the time it took to load. The result is shown along a timeline with the final tallies of page weight and load time displayed at the bottom. You can filter the display to show only certain types of files (JavaScript files or image files, for example).
You can also explore details about individual items, including the HTTP headers and content. Just hovering over an image in the display shows you a thumbnail and the image’s dimensions (this trick works everywhere in Firebug, incidentally).
For Ajax-enabled pages, you can also watch the background XMLHttpRequest requests and responses happen in real time, including the round-trip response time, headers, form queries and response content.
Advanced JavaScript Tools
Firebug’s inspection and editing tools are, on their own, plenty useful for dynamic HTML, since they always show the current state of the page. If your JavaScript inserts new elements or changes attributes or class names, the inspector shows that new info, helpfully highlighting the changed portions in yellow for a few seconds after the change happens.
But that’s just the tip of the iceberg. For starters, Firebug gives you feedback on JavaScript errors, detailing the source of the error and giving you one-click access to the problem line of code. Even better, Firebug includes a full-featured JavaScript debugger, an able replacement for the venerable Venkman debugger for Mozilla browsers.
Useful as a debugger can be, it’s sometimes more useful to simply dump info to the console. Firebug provides functions to add to your JavaScript functions so that you can do exactly that, leaving a trail of object data as your scripts run.
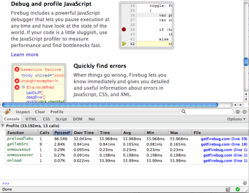
And how cool is this: A built-in JavaScript profiler allows you to benchmark script performance and review which functions on the page are soaking up the most time. Just click on the name of the function to open the script file to that function, where you can set debugger breakpoints.

Indispensable
Seriously, run don’t walk to download Firebug. This extension has saved me countless hours in the year since I started using it. It’s an amazing and sublime addition to the Firefox browser. Highly recommended.


